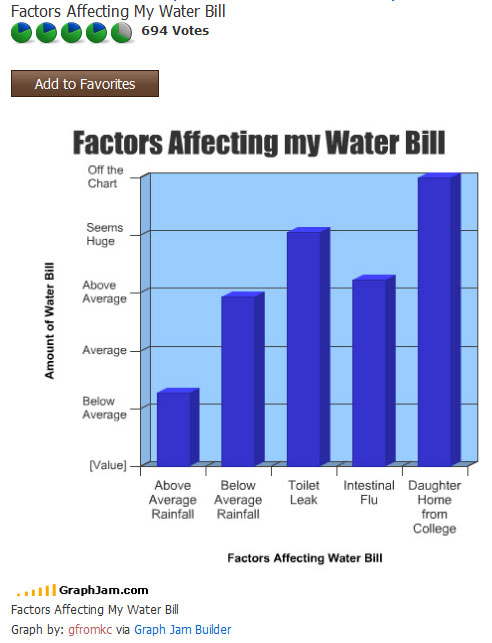
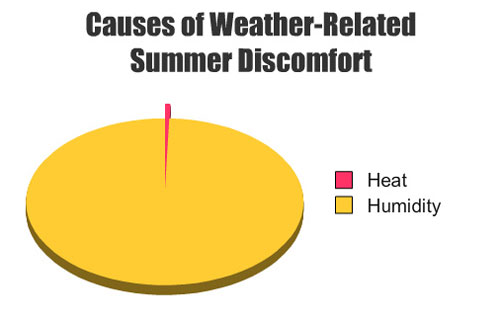
Chart: Summer Suffering in the Midwest
It’s not the heat, it’s the humidity! Oh dear, we’re at it again… instead of producing revenue or creating other things of value, I’m creating more fake charts for our amusement!
So what to do if terrible humidity is a problem? If you’re given humidity, make humi-nade! (Human Aid?!)
The Dew Bank Bottle by Ki-Tae Pak DOES in fact make humi-nade by gathering and collecting dew in desert conditions. The design won a Bronze Prize at the Idea Design Awards 2010 and interestingly, is inspired by a desert-dwelling beetle which procures water by collecting morning dew on its body.